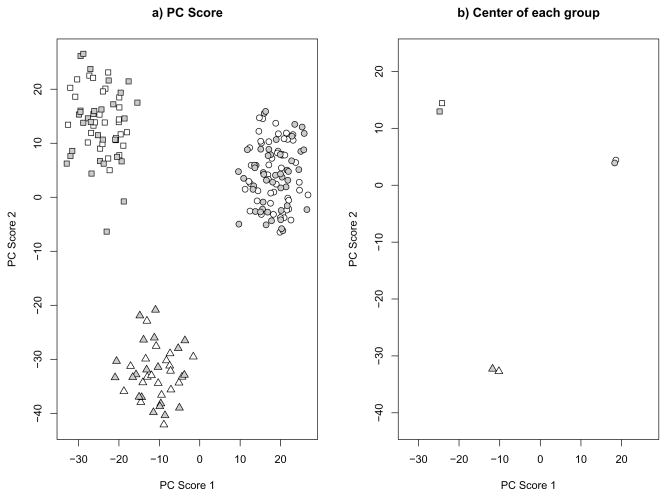
Fig 2.
Shrinkage Adjusted PC scores of the data in Figure 1. Different symbols represent different groups. White background color represents the training set and grey background color represents the test set. A) plots of all simulation samples. B) Center of each group.

