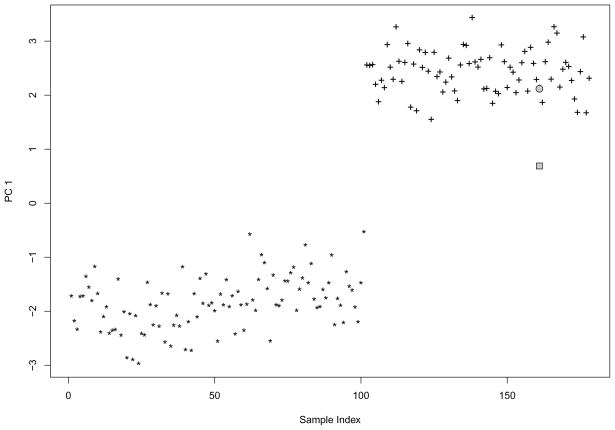
Fig 4.
An instance with and without shrinkage adjustment, performed on Hapmap CEU(*) and TSI(+). “*” and “+” represent PC scores using all data. The 161th sample was excluded from PCA, and PC score for it was predicted. The grey rectangle represents the predicted PC score without shrinkage adjustment and the grey circle represents the predicted PC score after the shrinkage adjustment

