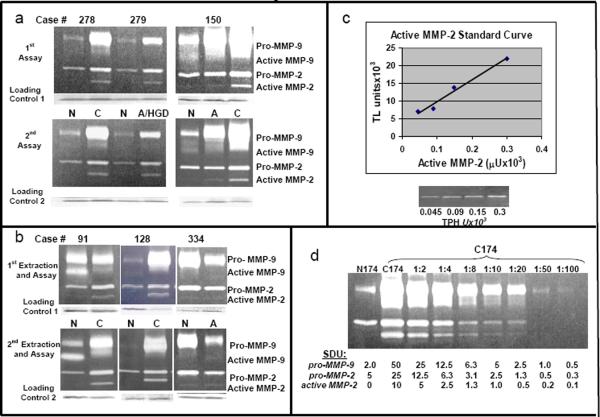
Figure 2.
2a. Zymogram patterns on duplicate gels. Reproducibility of gelatin zymogram banding patterns is illustrated for the same 3 cases (normal and cancer extracts for cases 278 and 279; normal, adenoma and cancer extracts for case 150) electrophoresed on different gels on different days. Samples were stored at −80°C between gel runs. A Coomassie blue stained loading control, as described in the methods section, is shown below each gel.
2b. Zymogram patterns for re-extracted and reassayed samples. Reproducibility of gelatin zymogram banding patterns is illustrated for 6 samples from the same 3 pairs (normal and cancer extracts from cases 91 and 128; normal and adenoma extracts from case 334) that were reextracted and assayed twice.
2c. Standard curve of purified active MMP-2 control. Graphs show gelatin zymography data for four serial dilutions of a purified commercial standard of active MMP-2. Gelatin zymogram results are shown below the graph. Defined activities are given for the purified standard (Calbiochem) in TPH units (thiopeptide hydrolysis units) based on the amount of protein loaded in that lane. Band activity levels were then determined by computer-assisted image analysis using Total Lab software (Nonlinear Dynamics) and resulting data in Total Lab Units (TLU) graphed to generate a curve. Total Lab Units (TLU) represent the activity band in units of intensity in pixels × band area, as plotted on the Y-axis versus commercial activity units for the standard on the X-axis.
2d. Representative serial dilution: Defining serial dilution units (SDU) on a zymogram gel. Tissue extracts (25 mg/lane) of normal mucosa (N174) and carcinoma (C174) for Case 174 were run in undiluted form (N 174, C 174) next to serial dilutions of the cancer sample for Case 174 as labeled above each lane (1:2 through 1:100). For each MMP activity band, the number of serial dilution units (SDU) in a given band for a given lane is shown below that lane. The weakest visible complete band of pro-MMP-9 activity (seen in the 1:50 dilution) was designated 1 SDU of MMP-9 activity with the SDUs for pro-MMP-9 bands in other lanes defined by the known dilution of sample in that lane. Similarly, the weakest complete band of MMP-2 (in the 1:10 dilution lane for active MMP-2) was designated 1 SDU of MMP-2 activity with SDUs for the remaining active MMP-2 (or proMMP-2) bands in other lanes defined similarly by the known dilution of sample in that lane.

