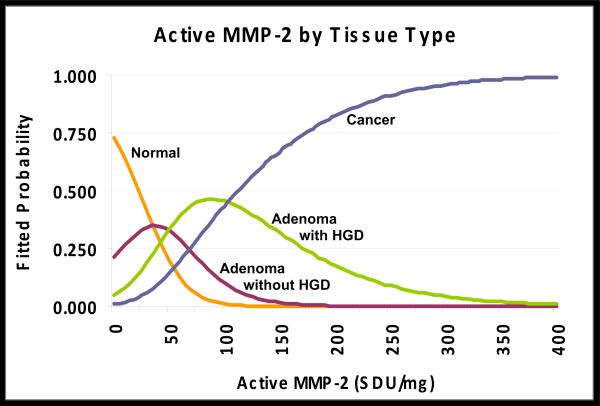
Figure 4. Multiple Regression.
Estimated probabilities of declaring a colorectal tissue sample as either normal, adenoma without HGD, adenoma with HGD or cancer graphed with respect to levels of active MMP-2 activity (SDU/mg) in that sample. At any given value a comparison of these probabilities permits prediction of the most probable diagnosis of the tissue as one of these four tissue types.

