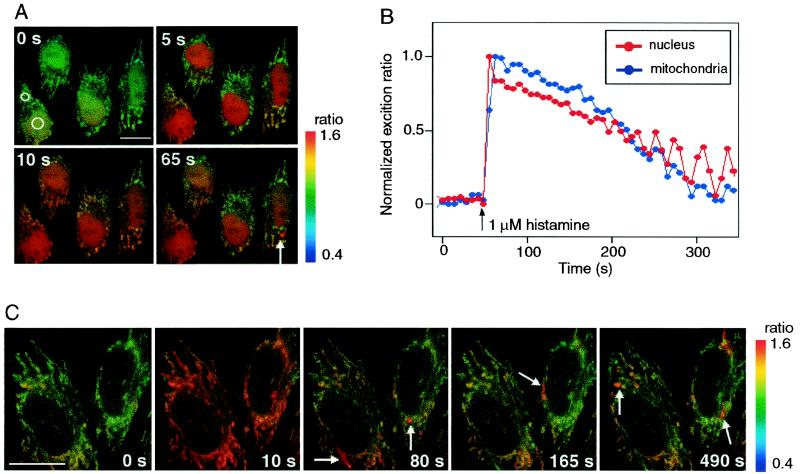
Figure 6.
(A) A series of pseudocolored images of four HeLa cells that expressed ratiometric-pericam-nu and -mt. From the Left Upper to the Right Lower, 0, 5, 10, and 65 s after 1 μM histamine application. Small and a large circles in the leftmost cell are regions of interest for measurements of [Ca2+]n and [Ca2+]m, respectively. Their time courses are shown in B. (C) A series of pseudocolored images of two HeLa cells expressing ratiometric-pericam-mt. Arrows indicate subpopulations of mitochondria transiently exhibiting high [Ca2+]m. (Scale bar = 10 μm.)

