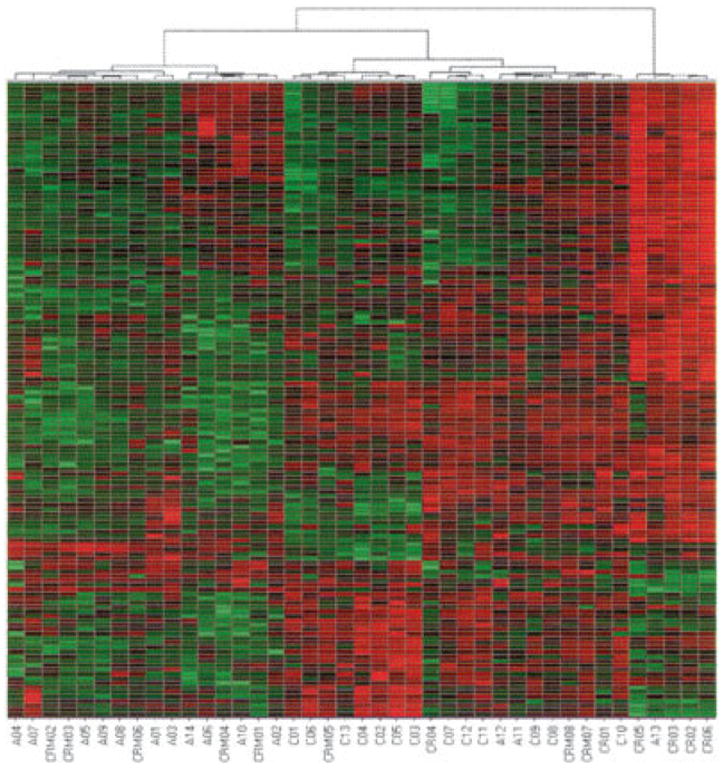
Figure 1.

Hierarchical clustering analysis derived from gene expression profiling of neutrophils from children with distinct polyarticular juvenile idiopathic arthritis disease states and of neutrophils from healthy controls. Each block represents an individual gene, and individual patients are depicted on the x-axis. Numbers prefixed with A indicate patients with active disease. Numbers prefixed with CRM represent patients with clinical remission of disease who were taking medication. Numbers prefixed with CR represent patients with clinical remission of disease who were not taking medication. Numbers prefixed with C represent healthy control children.
