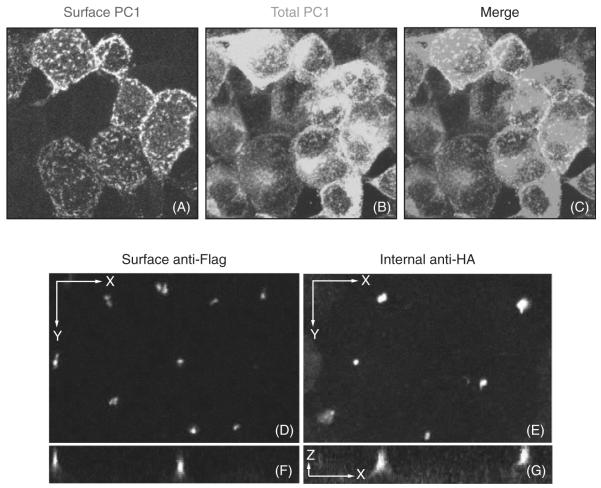
Fig. 3.
Examples of surface immunofluorescence under conditions that promote PC1 delivery to the plasma membrane and cilia. In nonpolarized HEK293 stably expressing PC1, the anti-Flag antibody shows the surface pool of PC1 (A), while the internal anti-HA antibody shows the overall PC1 expression (B). The merged image reveals the colocalization between internal and external markers (C). Images (A–C) were generated by flattening a z-stack of images obtained using confocal microscopy. Polarized LLCPK cells stably expressing PC1 have a ciliary localization of PC1, as revealed with both the surface anti-Flag antibody (D, F) and the internal anti-HA antibody (E, G); images shown in x–y and x–y projections. A slice along the z-axis shows that the HA antibody labels both ciliary and intracellular protein pools (G), while the surface anti-Flag antibody labels only cilia (F). The scale bar for (D–G) is 10 μm. (See Plate no. 15 in the Color Plate Section.)

