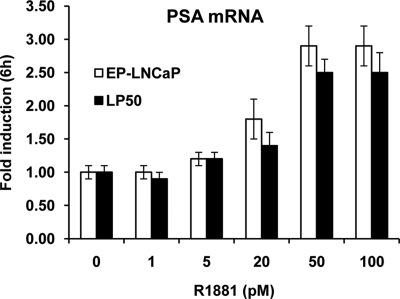
Fig. 4.
R1881 dose response of endogenous PSA expression in LP50 cells vs. EP-LNCaP cells. LP50 cells and EP-LNCaP cells were depleted of hormone and then treated with vehicle or R1881 (1–500 pm) in triplicate wells for 6 h. Total RNA was extracted from the cells, and the level of mRNA for PSA was measured by quantitative real-time RT-PCR. The values of the PSA mRNA levels were normalized to the corresponding values for GAPDH mRNA.

