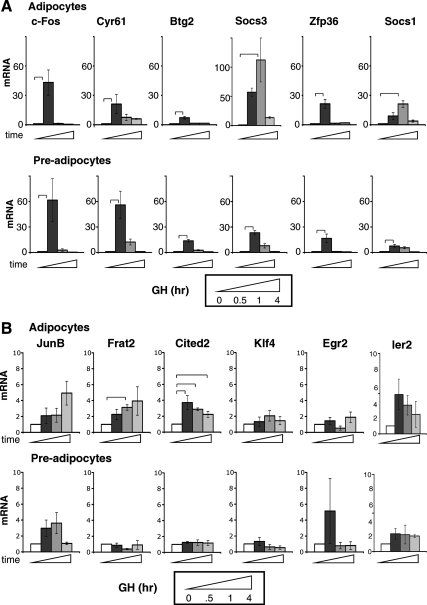
Fig. 1.
GH rapidly and transiently induces expression of multiple genes. A, Genes highly responsive to GH. B, Genes with lower responsiveness to GH. 3T3-F442A adipocytes (top) or preadipocytes (bottom) were treated with GH for various times as indicated. RNA was analyzed by qPCR. For each gene tested, mRNA induced by GH is shown after 0, 0.5, 1, or 4 h (open, dark, medium, and light gray bars, respectively). Each bar shows mean ± se for three independent experiments. mRNA expression at time 0 is set equal to 1. Brackets show responses that are significantly (P < 0.05) different between bracketed bars, in this and subsequent figures.

