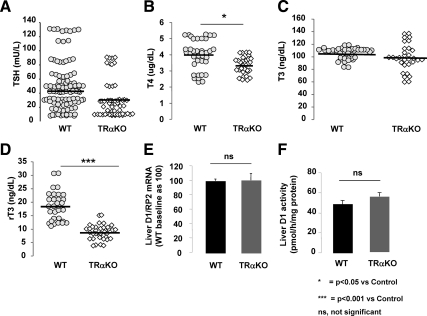
Fig. 1.
Serum tests of thyroid function and liver D1 mRNA content and enzymatic activity in TRαKO and WT animals. Serum TSH (A), T4 (B), T3 (C), and rT3 (D) concentrations in TRαKO and WT at baseline. D1 mRNA levels (E) and enzymatic activity (F) in liver of WT (black bars) and TRαKO (gray bars) mice at baseline. Data on D1 are expressed as mean ± sem; n = 7 animals per group. Statistical differences between groups are indicated.

