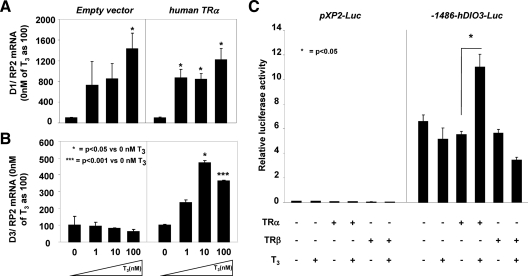
Fig. 3.
Overexpression of TRα induces D3 mRNA levels in GH3 cells after T3 treatment. D1 (A) and D3 (B) mRNA levels in pituitary GH3 cells after transfection with the empty pcDNA vector (left panel) or with hTRα plasmid (right panel) and treatment with increasing doses of T3 for 24 h (0, 1, 10, 100 nm). The experiment was repeated twice in triplicate. Data are expressed as mean ± sem. Significant differences between groups are indicated. C, T3-TRα regulation of human DIO3 promoter activity in GH3 cells: −1486 bp of the human DIO3 promoter or pXP2-Luc empty vector and hTRα or TRβ were cotransfected into GH3 cells and analyzed for luciferase activity after T3 treatment as described in Materials and Methods. Bars represent the mean ± sem of three different experiments, each performed in triplicate. Significant differences between groups are indicated.

