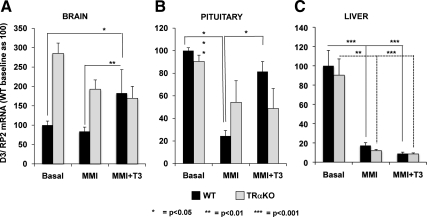
Fig. 5.
D3 mRNA levels in brain, pituitary, and liver of TRαKO (gray bars) and WT mice (black bars) after T3 treatment. Mice from the two genotypes were TH-deprived (MMI and potassium perchlorate) and then treated with T3 (MMI and potassium perchlorate + 2 μg of T3/ 100 g BW). D3 mRNA levels in brain (A), pituitary (B), and liver (C) of TRαKO and WT mice at baseline, during hypothyroidism, and after T3 treatment by qPCR. Bars represent the mean ± sem. Significant differences between groups are indicated; n = 7 animals per group.

