Figure 10.

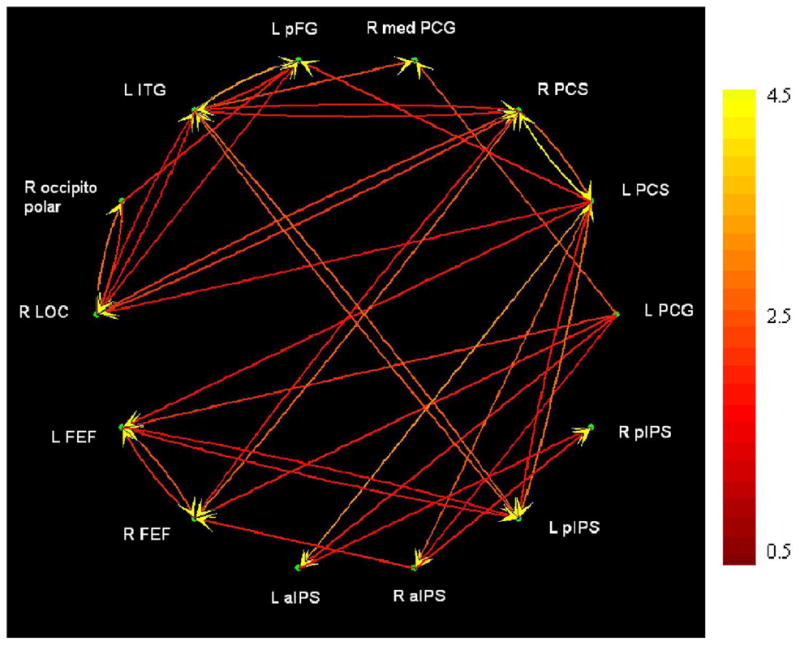
Effective connectivity as revealed by Granger causality analysis. The left aIPS focus also extended into the SMG. Abbreviations as in text. Color scale at right indicates path weights (arbitrary units).

Effective connectivity as revealed by Granger causality analysis. The left aIPS focus also extended into the SMG. Abbreviations as in text. Color scale at right indicates path weights (arbitrary units).