
Figure 7.
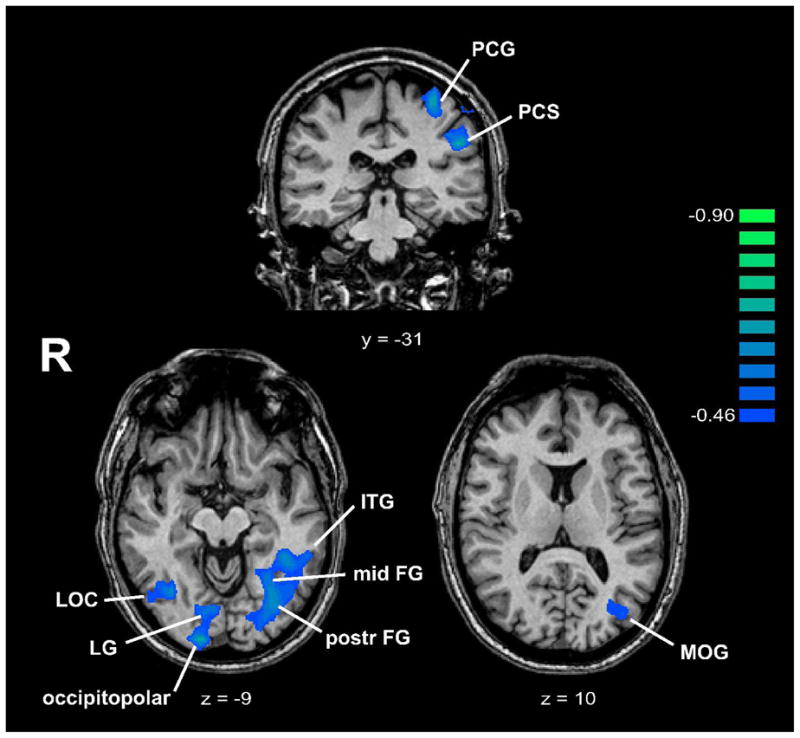
Regions where ANCOVA showed negative correlations between activation magnitude and acuity threshold, displayed on representative coronal/axial slices. Talairach y/z plane is indicated below each slice. R: right; other abbreviations as in text. Color r scale on right.