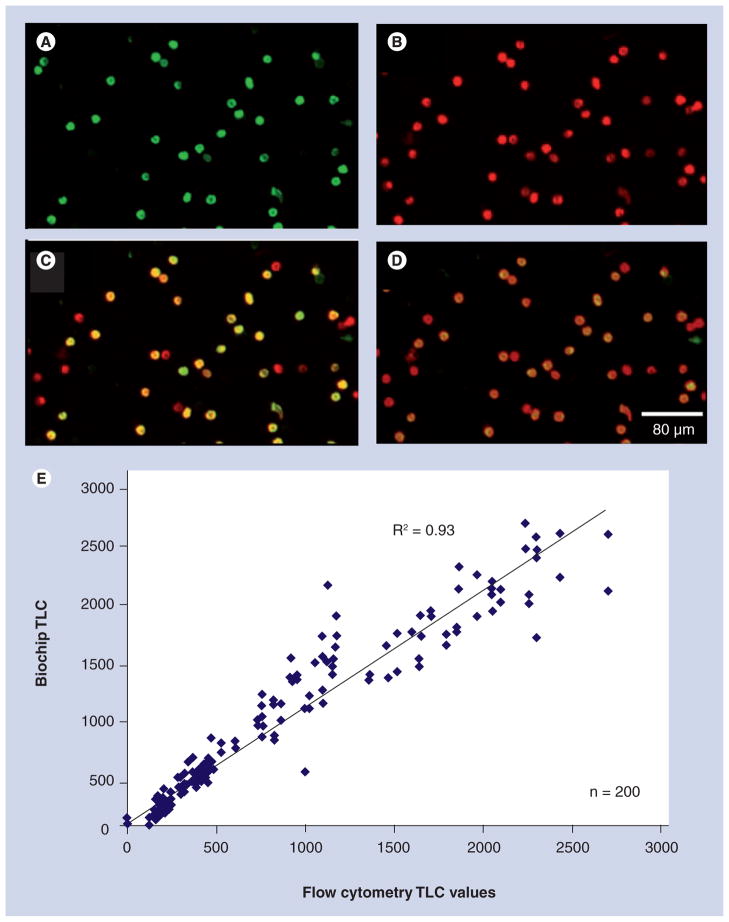
Figure 4. Cellular processing unit.
Representative photomicrographs of whole blood labeled with a CD-specific antibody and quantum dot (QD) fluorescently tagged secondary antibody taken with a 10× objective and 3 s of exposure time. The QD 565 labels CD4+ cells including monocytes and T lymphocytes in the green channel (A) while QD 655 stains CD3+ lymphocytes red (B), as observed through separate filter cubes specific to each fluorophore. A digital overlap of the red and green images (C) shows monocytes (CD3+CD4+, green), T lymphocytes (CD3+CD4+, yellow) resulting from signal both in red and green channels, and remaining NK and CD8+CD3+ T-killer lymphocytes (CD3+CD4+, red). An alternative approach (D) utilizes a long-pass emission filter cube (520 nm and longer) allowing a single capture event to produce a similar image to that generated by separate photomicrographs. This membrane-based method was used to analyze a large sample set and found to correlate to flow cytometry for total lymphocyte counts at R2 = 0.93 and T lymphocyte counts at R2 = 0.97 (E) [36]. TLC: Total lymphocyte count.

