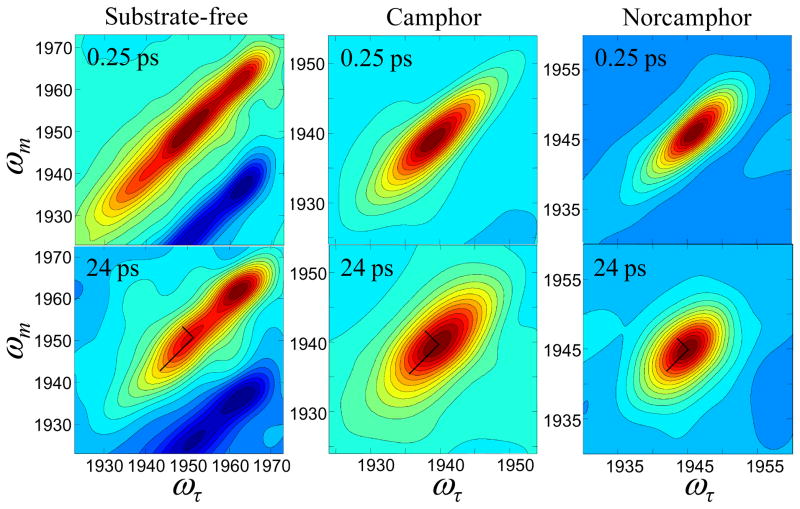
Figure 3.
2D IR spectra of substrate-free cyt P450cam-CO (left), the complex with camphor (middle), and the complex with norcamphor (right), at short (upper) and long (lower) Tw delay times. The spectral region around the 0–1 transition is shown, with the contour lines representing a 5 % change in amplitude. To illustrate the differences in lineshapes, lines are drawn over five contours along the diagonal and antidiagonal in the 2D IR spectra with Tw of 24 ps.

