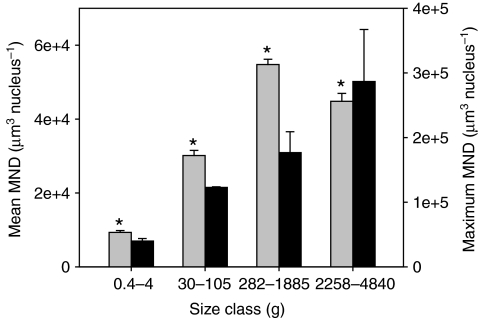
Fig. 8.
Comparison of mean MND (gray bars, left y-axis) and maximum MND (black bars, right y-axis) in anaerobic white muscle from black sea bass ranging from 0.45 to 4840 g. Asterisks indicate that the mean MND size from each size class is significantly different from all other size classes. For maximum MND, the only size classes different from each other are ‘very small’ and ‘large’. Data are means ± s.e.m.

