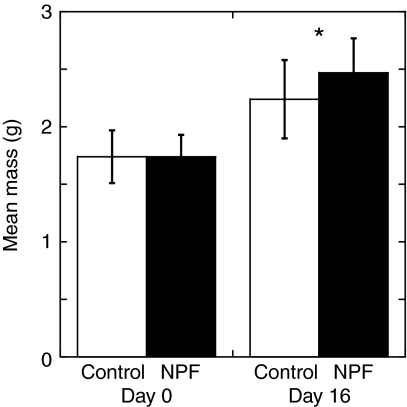
Fig. 9.
Mean mass of control and NPF-treated shrimp at the beginning of the experiment (day 0) and at the end (day 16). NPF-treated individuals had their diet enhanced with a daily addition of 2 μl of 10–3 mol l–1 synthetic Litva-NPF I peptide during the 5-day trial period (but not during the pre- and post-trial periods). Initial mean masses of control and NPF-treated shrimp were the same. An approximately 10% difference in mean masses was seen between the NPF-treated animals and the control shrimp at day 16 (see Table 3 for statistical results). Number of shrimp in each treatment: 20. Error bars show the standard deviation. Significance: *P≤0.05.

