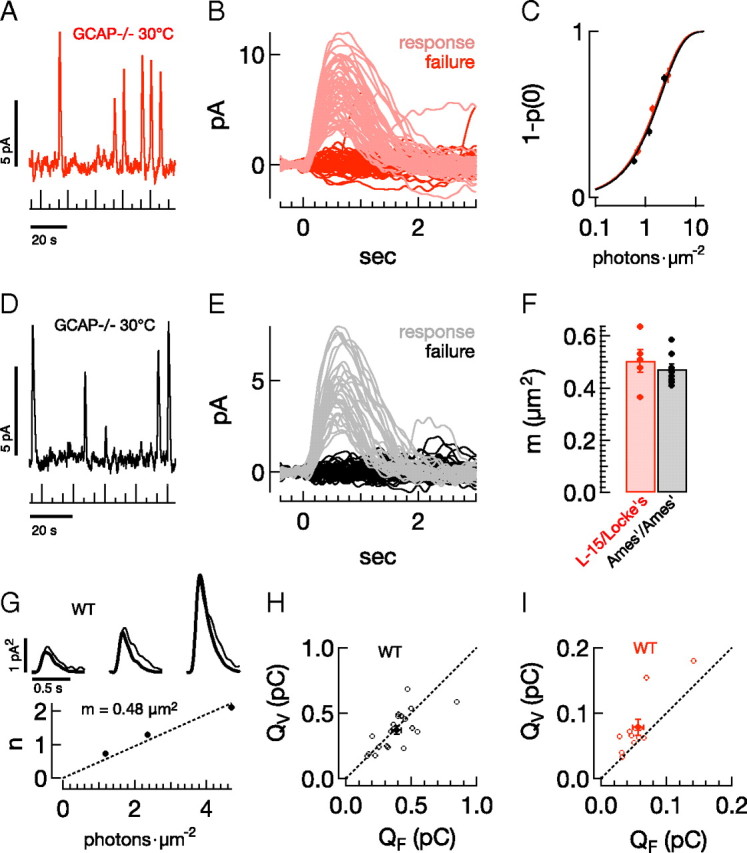
Figure 3.

The rod collecting area does not depend on the experimental protocol. A–F, Frequency of seeing analysis for GCAP−/− rods. A, Raw current trace from GCAP−/− rod in L-15/Locke's, showing responses to three repeated flash strengths (0.7, 1.4, or 2.8 photons · μm−2, stimulus trace below, 30°C). B, Superimposed responses to a flash with strength of 1.4 photons · μm−2, p0 = 0.54. C, The average probability of observing a response (1 − p0), as a function of flash strength, for populations of GCAP−/− rods in both L-15/Locke's (red, n = 5) and Ames'/Ames' (black, n = 8). Smooth lines show the Poisson prediction, 1 − p0(I) = 1−e−mI, with m = 0.50 μm2 in L-15/Locke's and 0.47 μm2 in Ames'/Ames'. D, Raw current trace for Ames'/Ames' condition (flash strengths: 0.6, 1.2, or 2.4 photons · μm−2). E, Superimposed responses to a flash with strength of 1.2 photons · μm−2, p0 = 0.64. F, Collecting areas (CA) from individual GCAP−/− rods in L-15/Locke's (red, 0.50 ± 0.04 μm2), and Ames'/Ames' (black, 0.47 ± 0.02 μm2). G–I, Comparison of variance and frequency of seeing estimates. G, Top, Variance (thin trace) and scaled mean-squared response (thick trace) in a representative rod in Ames'/Ames' (see Materials and Methods) for flash strengths of 1.18, 2.36, and 4.72 photons · μm−2. Scale bars are 0.5 s and 1 pA2. The reciprocal of the scale factor applied to the mean-squared response gives the mean number of effective photon absorptions, n. Bottom, The collecting area, m, is the slope of the best fit line (dotted line) through the n vs I data, in this case, 0.48 μm2. H, Population data in Ames'/Ames' for the integral of the estimated single-photon response using the variance-to-mean-squared method, QV (y-axis, pC) and using a fixed collecting area of 0.5 μm2, QF (x-axis, pC). Filled circles give the average across the population ± SEM. I, Same as H for L-15/Locke's.
