Figure 4.
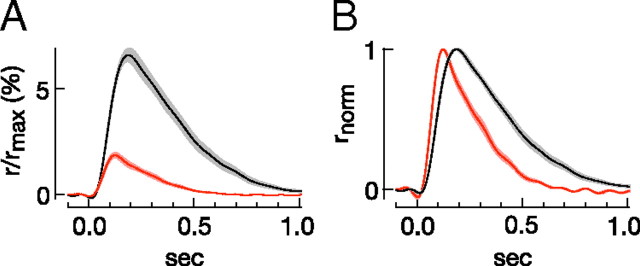
The single-photon response depends on the experimental protocol. A, Average single-photon responses as a percentage of suppressible current for rods in L-15/Lockes (red, n = 15) and Ames'/Ames' (black, n = 20). Contours are the SEM across a population of rods. B, Normalized responses from A.

