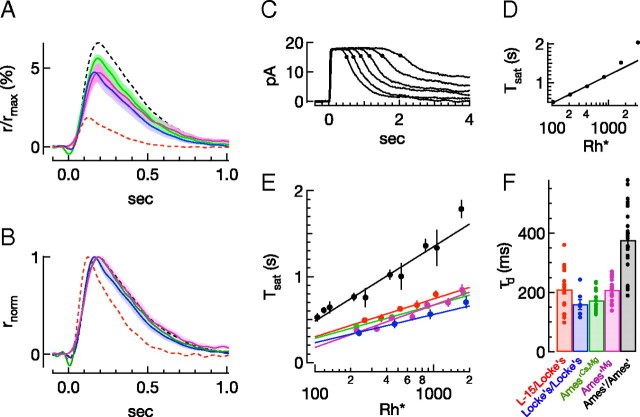
Figure 5.
Dependence of single-photon response and dominant time constant of recovery on divalent concentration. A, Average single-photon responses in different conditions (±SEM), using a fixed collecting area: Locke's/Locke's (blue), Ames'Ca,Mg/Ames'Ca,Mg (green), and Ames'Mg/Ames'Mg (magenta). The Ames' conditions match either Mg2+ alone or both Ca2+ and Mg2+ concentrations in Locke's. B, Normalized single-photon responses in the same conditions and colors. Dashed lines in A and B show single-photon responses from Figure 4: L-15/Locke's (red), Ames'/Ames' (black). C–F, Estimate of the dominant time constant for recovery of light-activated PDE activity. C, D, Illustration of the technique. For a family of responses to bright flashes (Ames'/Ames'; 105, 208, 415, 829, 1658, 3315 Rh*), the time at which a response recovers 15% of the dark current (C) is plotted against the logarithm of the flash strength (D). The slope of this linear relationship estimates the dominant time constant of recovery, in this case, 312 ms. E, Average (log(i), Tsat) pairs for all cells in a given condition; only points below 1000 Rh* are fit. Slopes of best fit lines are as follows: L-15/Locke's, 192 ms; Locke's/Locke's, 143 ms; Ames'Ca,Mg/Ames'Ca,Mg, 168 ms; Ames'Mg/Ames'Mg, 214 ms; Ames'/Ames', 371 ms. F, Summary of dominant time constants from fits to data from individual rods as in D (see also Table 1).

