Figure 6.
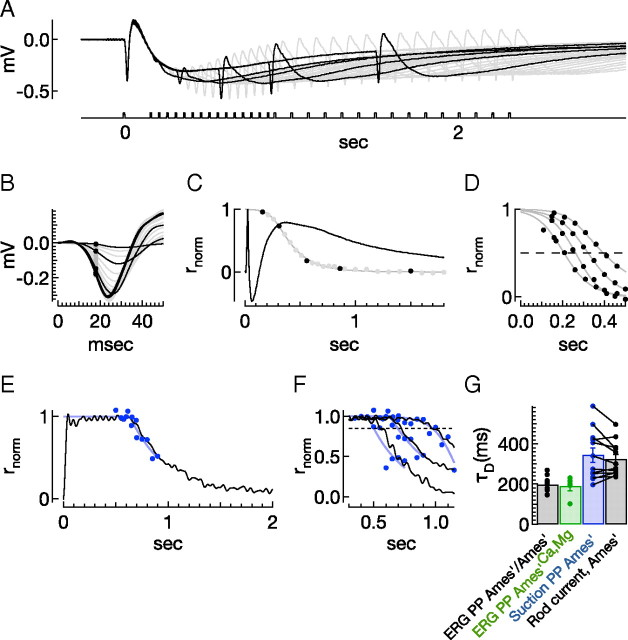
Dominant time constants of ERG-derived rod responses show little dependence on divalent concentration. A, ERGs in response to increasing delays between a test (834 Rh*) and probe (834 Rh*) flash (stimulus trace below). Black responses are followed through the subsequent panels. B, Rising phases of the responses to the probe flash, aligned to the time of the flash, when presented alone (thick black trace), and when following a test flash. Dots represent points of comparison to the thick curve, at the point of fastest change (18 ms). This comparison measures the fraction of the remaining rod response, R(ti). C, Fractional response suppression, F(ti) = 1 − R(ti), as a function of the delay between test and probe flashes; the smooth gray curve is the best fit recovery function (see Materials and Methods) (t1/2 = 210 ms, a = 30.6, h = 0.1). The thin black trace is the ERG in response to the test flash alone. D, Four derived rod responses (298, 417, 596, and 834 Rh*). The dashed line plots the 50% criterion level used to determine the dominant time constant. E, Paired-pulse analysis in single rod outer segments (664 Rh*) (F, 332, 664, 1327 Rh*). G, Comparison of dominant time constants for ERG-derived responses in Ames'/Ames' (n = 9) and Ames'Ca,Mg/Ames'Ca,Mg (n = 5) conditions and single-rod recordings using paired-pulse analysis or directly from the current response (as in Fig. 5). Lines for single-cell recordings connect measures from the same cell.

