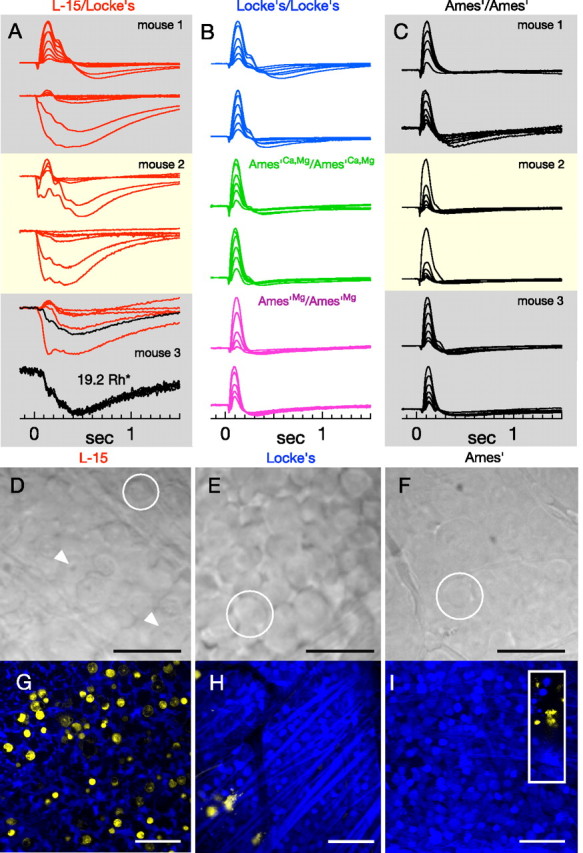
Figure 8.

The viability of retinal tissue under different conditions: in vitro ERGs, morphology, and Live/Dead staining. A–C, Normalized ERGs in response to flash families from individual isolated retinas (∼0.5–40 Rh*/rod). ERGs measured from half of one retina placed in L-15/Locke's conditions (A) (both halves in one box) were followed by ERG recordings from the other retina in Ames'/Ames' (C) (labels identify retina from the same mouse). Each trace is the average of ∼5 responses. The bottom panel depicts individual responses comprising the trace in black in the above flash family (19.2 Rh*). B, Representative ERG families from tissue in Locke's/Locke's (blue), Ames'Ca,Mg/Ames'Ca,Mg (green), and Ames'Mg/Ames'Mg (magenta). ERGs of retina in L-15/Locke's exhibit greater variability than other conditions. D–F, Differential interference contrast images of flat-mounted retinal tissue following storage in cold L-15 (D), warm (32°C) Locke's medium (E), and warm (32°C) Ames medium (F). Scale bars, 25 μm. Circles indicate ganglion cell somas and arrows in D illustrate prominent, pockmarked nuclei. G–I, Confocal images through the ganglion cell layer of live (blue) and dead (yellow) tissue following storage in cold L-15 (G), warm Locke's (H), or Ames' (I) (inset, yellow stained cells at the edge of the retina piece). Scale bars, 50 μm. Counts of yellow nuclei (mean ± SEM) in images of retina stored in cold L-15, 119 ± 32 (n = 8); warm Locke's, 5 ± 1.7 (n = 4); Ames' with elevated Mg2+, 2 (n = 2); Ames', 2.6 ± 0.9 (n = 5). An image of healthy retina on this scale contained 286 ± 16 ganglion cells.
