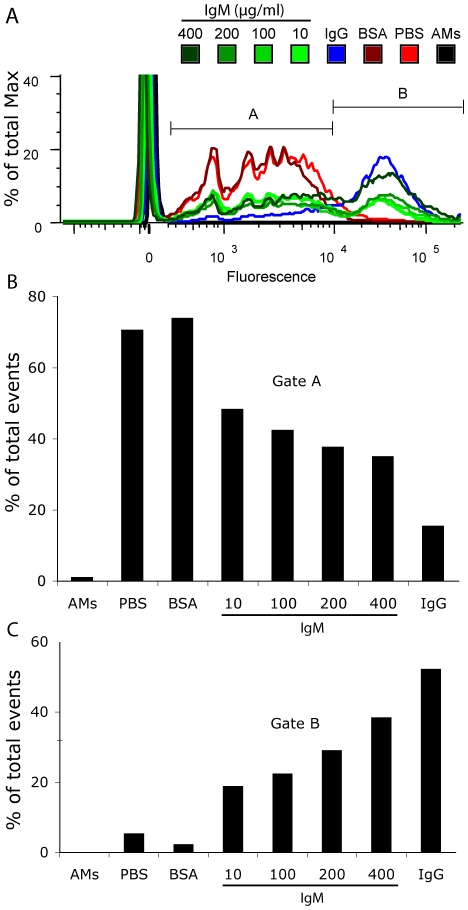
Figure 6. Flow cytometry reveals that IgM enhances the binding and uptake of small particles by macrophages in a concentration-dependent manner.
(A) Overlay comparison (% of Max) of IgM-coated (10, 100, 200, 400 µg/ml), IgG-coated (100 µg/ml), BSA-coated (100 µg/ml) or DPBS-suspended beads. IgM conditions are represented with varying hues of green lines, IgG in a blue line, BSA in dark red, PBS in bright red, and macrophages alone with a black line. Gates A and B partition cells containing beads to resolve the population of cells containing few beads from those with many beads. (B) Gate A represents the population of cells (% of total events) with few beads as indicated by lower fluorescent values. (C) Gate B represents the population of cells (% of total events) with many beads as indicated by higher fluorescent values.

