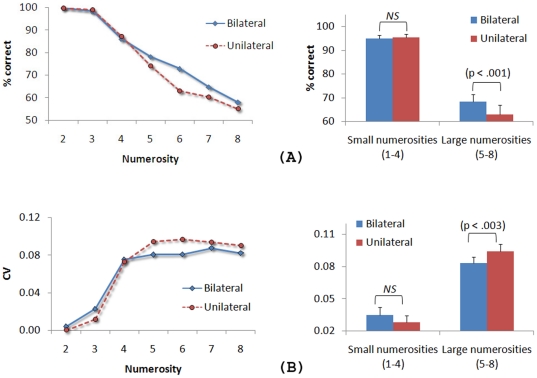
Figure 2. The results of Experiment 1.
(A) Percentage of correct responses and coefficients of variation as a function of condition and numerosity. (B) Averaged percentage of correct responses and coefficients of variation divided across small and large numerosities. The p value is shown when the difference between the bilateral and unilateral conditions is significant. ‘NS’ (i.e., ‘non significant’) is shown when the difference is not significant. The error bars represent ±1 standard error of the mean. No error bars are shown in (A) to preserve the readability of the data.

