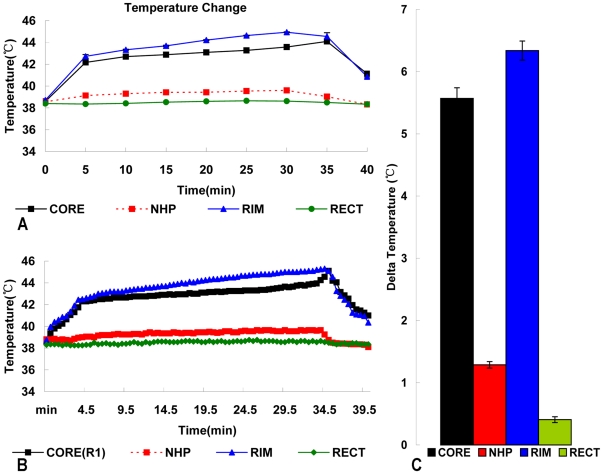
Figure 4. Temperature profiles during AEH treatment.
Figure 4A Typical heating curve for the temperature of the tumor core, rim, normal liver tissue, and rectum of Subject 1 in Group 5, from baseline to temperature during AEH treatment. Figure 4B Typical mean heating curve for the temperature of each subject in Group 5 during AEH treatment. Intratumor and rim temperatures increase rapidly to 42.5°C within 5 min and are then maintained above 42.5°C for 30 min, while the temperature inside NHP and the rectum remain below 40°C. Figure 4C Intratumor and rim delta temperature changes show the specific heating of the tumor during treatment.

