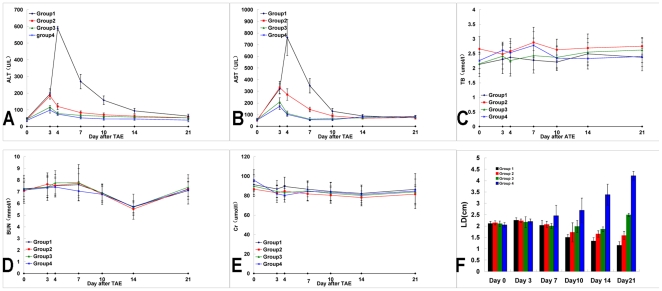
Figure 5. Biochemical tests and antitumor effect.
Figure 5A and B The diagram shows ALT level changes in groups 1 to 4. ALT levels tended to increase significantly more in Group 1 than in the other groups 1 day after the animals were subjected to hyperthermia, but gradually decreased. AST levels changed in the same manner as did ALT levels. Figure 5C Plasma TBil levels did not change appreciably in any group. Figure 5D and E The renal function test, in which the plasma BUN and Cr values were detected, showed no statistically significant differences among the groups. Figure 5F Antitumor effect evaluated by the tumor long-axis dimensions in both the control and treatment groups. During the experimental period, the mean LD decreased significantly more in groups 1 and 2 than in the other two groups.

