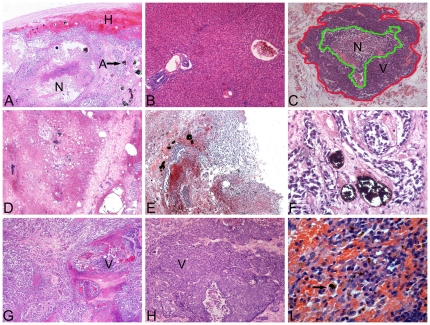
Figure 7. Representative histopathological (H&E) findings.
Figure 7 A–I A: Original magnification: H&E, 100×. Section of a VX2 liver tumor treated with AEH mediated by ATONs (A) at the periphery, which was surrounded by NHP (H). A necrotic central core (N) is surrounded by an area of debris, inflammatory reaction, and fibrosis. B: Original magnification: H&E, 100×. Section through NHP 7 days after arterially embolized ATONs. The liver architecture is preserved. C: For each H&E histological image, both an outer tumor border (red line) and inner regions of necrosis (green line) were manually circumscribed to permit reference-standard histopathology-based necrosis-rate measurements. Original magnification: H&E, 25×. D: Original magnification: H&E, 100×. Microscopic image in Subject 4 from Group 2 treated with ATON embolization, showing ATONs deposited within the vascular system. Three days after embolization, an area of necrosis together with inflammatory cell infiltration and extensive fibrosis surrounding the necrotic area were evident. The area of necrosis was not as extensive as in Group 1. E: Original magnification: H&E, 100×. Pathological specimen from a rabbit in the hyperthermia group shows massive necrosis of the tumor and aggregates of ATONs that have embolized within the vascular system of the tumor. The VX2-implanted region in the liver has been replaced by scar tissue. Histological changes include hemorrhage, chronic inflammation, and necrosis. No viable tumor cells are evident in either the rim or center of the tumor. F: Original magnification: H&E, 200×. ATON aggregates confined within a blood vessel, surrounded by necrotic tumor cells 14 days after ATON arterial embolization. The tumor cells in the treated animal appear shrunken, and their nuclei are pyknotic. G: Original magnification: H&E, 100×. H&E-stained micrograph of a lipiodol-treated tumor at day 7 showing the presence of damaged tumor cells; note the intermixed areas of clearly viable tumor (V), indicating potential spread of the tumor beyond its circumscribed boundary. H: Original magnification: H&E, 100×. H&E-stained section of tumor from a control rabbit (Group 4) shows areas of viable tumor (V). I: Original magnification: H&E, 200×. Macrophages associated with ATON aggregates (black arrow) in the spleen 14 days after ATON arterial embolization.

