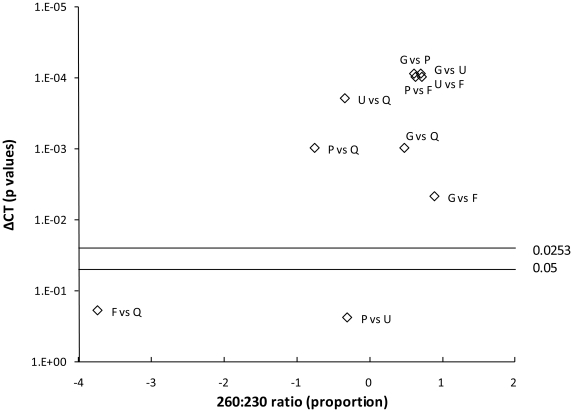
Figure 5. Linking inhibition to DNA purity.
Smile plot of the pairwise comparison between each method for ΔCt values (p values, Wilcoxon rank sum test) against the A260/230 ratio (expressed as proportion of the values for the two methods). The cut-off p value (0.05) and the Holland correction factor (adjusted cut-off p value 0.0253) are shown. G: Griffiths; P: Powersoil™; U: Ultraclean™; F: FastDNA® Spin kit; Q: QIAamp Stool kit.

