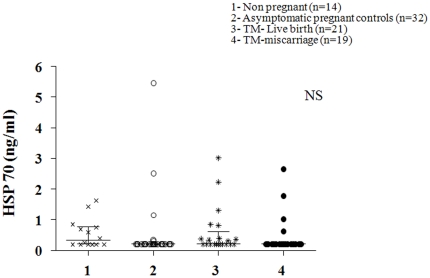
Figure 4. Scatter plot of circulating levels of serum heat shock protein 70 (Hsp 70) in the different groups of women with median and interquartile range.
Group 1 (non-pregnant women, n = 14), group 2 (normal pregnant women, n = 32), group 3 (threatened miscarriage patients with a live birth outcome, n = 21) and group 4 (threatened miscarriage patients with a subsequent miscarriage, n = 19). General linear analysis of variance was carried out to study the statistical significance between the groups with posthoc tests. NS = not significant.

