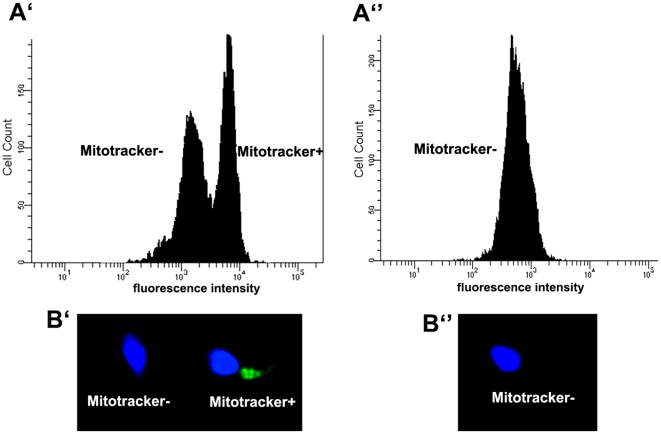
Figure 2. Sperm sample incubated with MitoTracker Green.
A. Representative histograms obtained using flow cytometry A′) Two subpopulations are obtained and can be sorted: MitoTracker positive (stained sperm) and MitoTracker negative (unstained sperm); A″) Sperm sample incubated with MitoTracker Green and FCCP, a MMP-disrupter. MitoTracker green labelling patterns observed by fluorescence microscopy: B′) MitoTracker positive (stained sperm) and MitoTracker negative (unstained sperm) sperm; B″) MitoTracker negative (unstained) sperm observed after incubation with MitoTracker Green and FCCP. For imaging purposes, nuclear DNA was stained with the DNA dye Hoechst 33342 (Molecular Probes).

