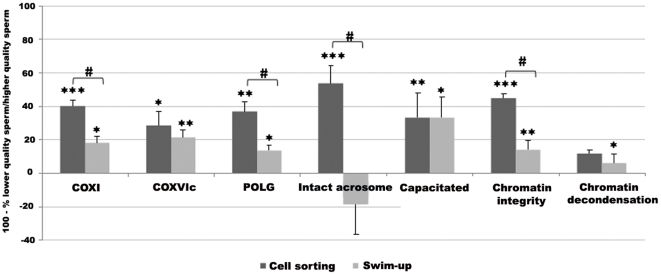
Figure 6. Comparison between sperm fractionation methods: cell sorting after MitoTracker Green staining versus swim-up.
Bars represent mean ± SEM of 100 – (MT-G negative sperm/MT-G positive sperm x 100) and 100 – (Non migrated sperm/Migrated sperm x 100). Asterisks denote differences between subpopulations: MitoTracker positive compared to MitoTracker negative sperm; migrated compared to non migrated sperm (*** P<0.001; **P<0.01; *P<0.05).Cardinals denote differences between the fractionation methods (Ps <0.001). Sample numbers = 30 for COX I expression, COX VIc expression and chromatin decondensation, 34 for POLG expression, 15 for acrosome integrity, 20 for capacitation status and 40 for chromatin integrity.

