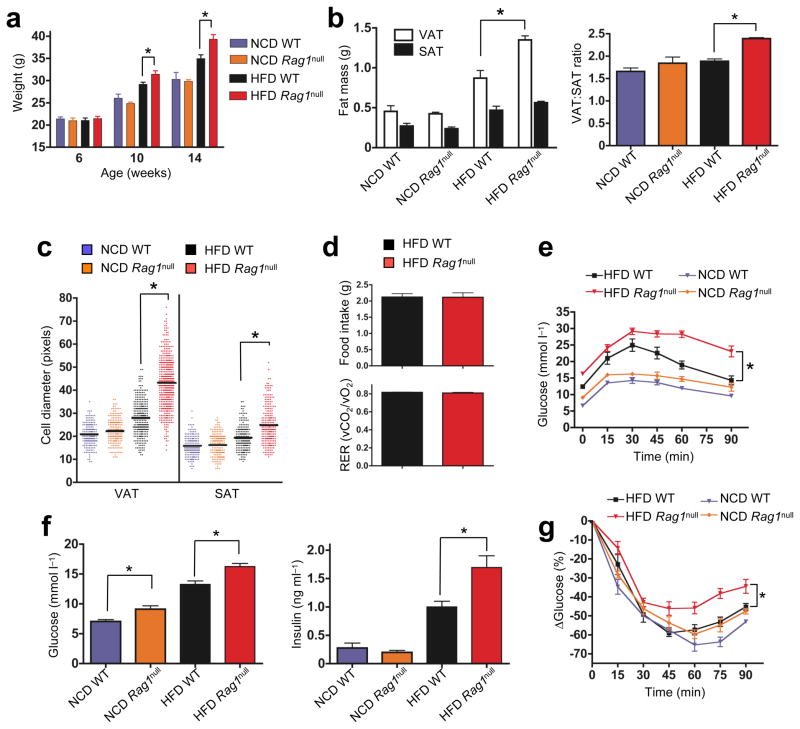
Figure 2. Impact of lymphocyte deficiency on weight gain, fat distribution, glucose tolerance and insulin resistance.
a) Body weights of >6 wk old WT and RAGnull B6 mice on NCD (n=20/group) or HFD (n=20/group, *p<0.03, Mann-Whitney, WT vs. RAGnull). b) Weights of single epididymal VAT and inguinal SAT pads from 14–15 wk WT and RAGnull mice on NCD or HFD (left panel: n=6 mice/group, *p<0.03, t-test), right panel: VAT:SAT ratio, *p<0.001, t-test. c) Relative fat cell diameter (see methods, n=3 mice/group, *p<0.0001, Mann-Whitney). d) Food intake (top panel) and respiratory exchange ratio (RER, bottom panel) in HFD WT or RAGnull mice (n=4/group). e) Glucose tolerance of RAGnull or WT mice on NCD or HFD (n=10/group, *p<0.02, 2-way ANOVA). f) Fasting glucose (left panel) or insulin blood levels (right panel) in 14 wk old HFD and NCD WT or RAGnull mice (n=10 mice/group, *p<0.05, t-test). g) Insulin tolerance test (ITT) in 14 wk old WT RAGnull mice on NCD or HFD (n=6–10/group, *p<0.05, two-way ANOVA).

