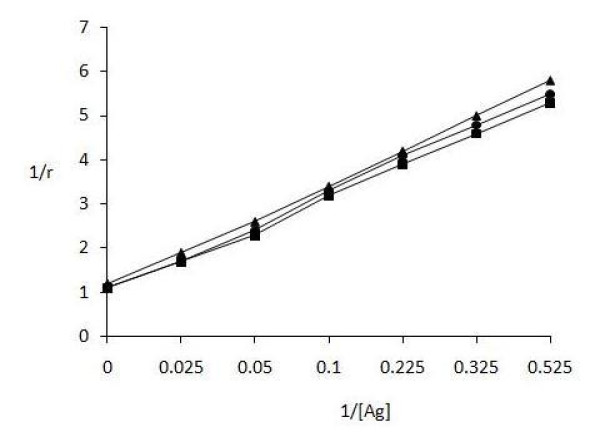
Figure 3.
Determination of apparent association constant for N-GAD65 by Langmuir plot. Langmuir plot of reciprocal of bound antigen concentration to antibody (1/r) versus reciprocal of free antigen concentration (1/[Ag]). Antigen and antibody binding between N-GAD65 and IgG from nephropathic (-■-) serum no.3, retinopathic (-●-) serum no. 6 complicated T1D and uncomplicated (-▲-) (serum no. 11) T1D subjects. Each value represents mean ± SD of four independent assays.

