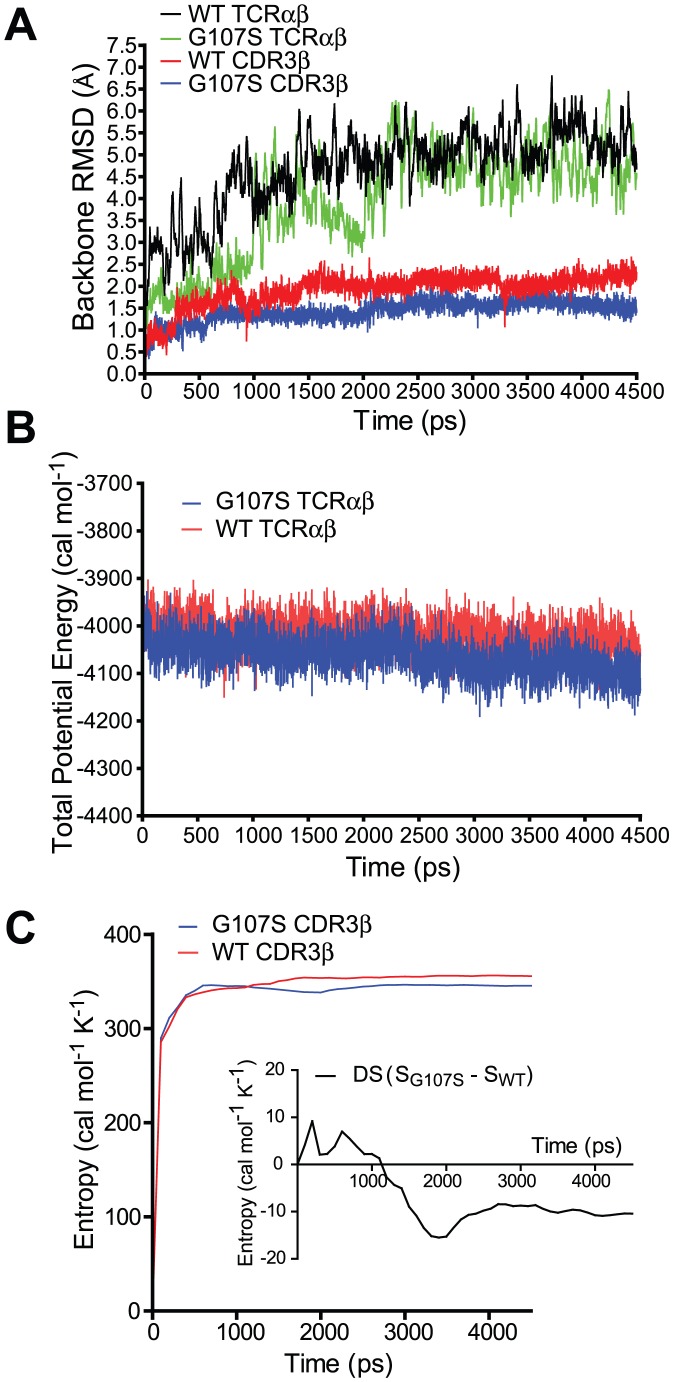
Figure 7. Molecular Dynamics analysis of a G107S mutation.
WT or G107S mutant 172.10 TCR underwent 4.5 ns of MD. (A) RMSD from initial structure of the TCRαβ or the CDR3β is plotted versus time of MD. (B) Potential energies, an indicator of overall structural stability, of TCRαβ structures during the course of MD is plotted. (C) Entropic analysis of the CDR3β backbone is shown. Inset demonstrates the difference in entropy between wt and mutant CDR3β.

