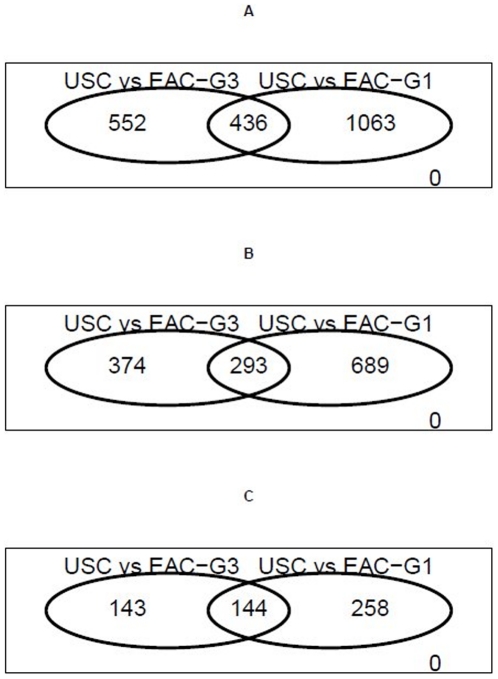
Figure 2. Venn diagrams showing the number of differentially expressed genes (DEGs) derived from USC vs. EAC-G3 comparison is consistently less than that derived from USC vs. EAC-G1 comparison.
A) DEGs as defined by P-value <0.01. B) DEGs with at least 1.5-fold change. C) DEGs with at least 2-fold change.

