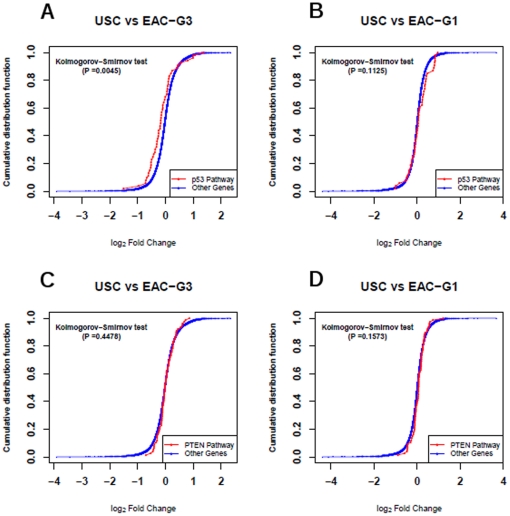
Figure 4. Log2 fold change of microarray estimated expression for genes from an investigated pathway are plotted as a cumulative distribution function (in red color) and compared with the corresponding cumulative distribution function for the rest of genes (i.e., not belonging to the investigated pathway, in blue color).
A) P53 signaling pathway in USC vs. EAC-G3 comparison. The two cumulative distribution functions are significantly different (P = 4.5e-3) by the Kolmogorov-Smirnov test. B) P53 signaling pathway in USC vs. EAC-G1 comparison. C) PTEN signaling pathway in USC vs. EAC-G3 comparison. D) PTEN signaling pathway in USC vs. EAC-G1 comparison.

