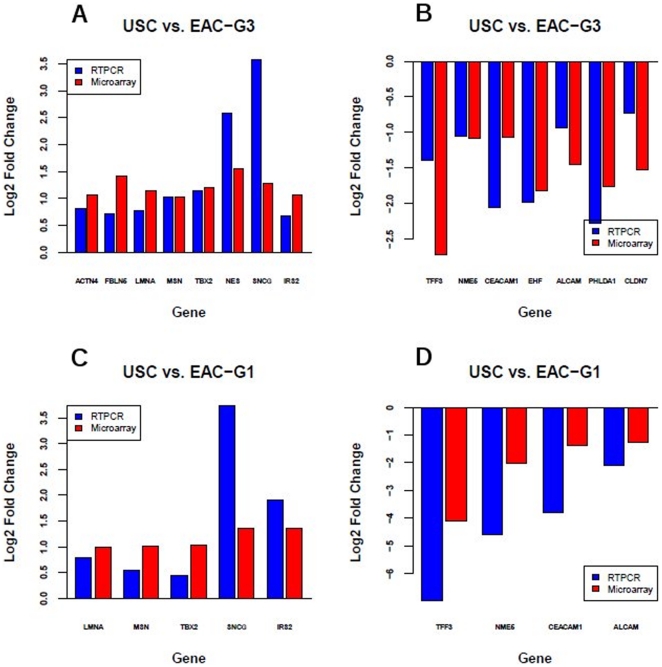
Figure 5. qRT-PCR validations of selected differentially expressed genes with at least 1.5-fold expression change identified by microarray.
Blue bar is the fold change estimated by qRT-PCR, while red bar is the fold change estimated by microarray. The fold change is shown in log2 scale. A–B) For USC vs. EAC-G3, 15 of 15 selected genes showed at least 1.5-fold change in qPCR estimated expression levels and was concordant with the microarray data. C–D) For USC vs. EAC-G1, 7 of 9 selected genes showed at least 1.5-fold change in qPCR estimated expression levels and was concordant with the microarray data. The two genes with less than 1.5-fold change in expression level based on qPCR are MXN and TBX2.

