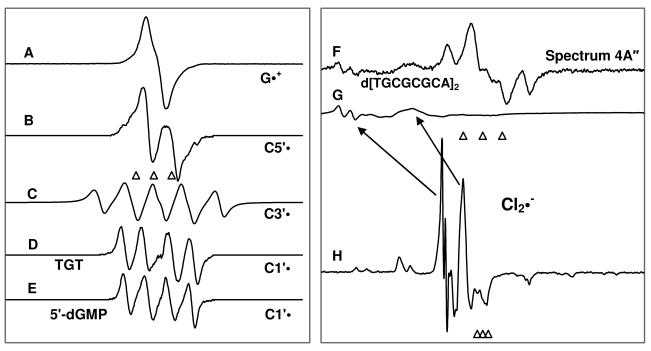
Figure 1.
Benchmark spectra used for computer analysis. (A) G•+ produced from dGuo via one-electron oxidation by Cl2•− at pD ca. 3. 14, 15 (B) C5′•, formed via photo-excitation of G•+ in 8-D-3′-dGMP.9 (C) C3′•, produced via photo-excitation of G•+ in dGuo.9 (D) C1′•, produced via photo-excitation of G•+ in TGT. 11 (E) C1′•, produced via photo-excitation of G•+ in 5′-dGMP.9 (F) As an example of the formation of the matrix radical (Cl2•−) owing to 405 nm photoexcitation of one-electron oxidized G (hole transfer to the matrix), the spectrum 4A″ is shown here. (G) Partial spectrum (220 G scan) of the total Cl2•− spectrum (1000 G scan) shown in spectrum 1(H). The scan range of Cl2•− spectrum shown in Figure 1(G) matches those of 1(A) to 1(E). (H) the Cl2•− spectrum obtained via γ-irradiation of 7.5 M LiCl/D2O solution containing persulfate to capture electrons followed by annealing at 143 K for 20 min.18
The three reference markers (open triangles) in this Figure and in other Figures show the position of Fremy's salt resonance with the central marker at g = 2.0056. Each of these markers is separated from each other by 13.09 G.

