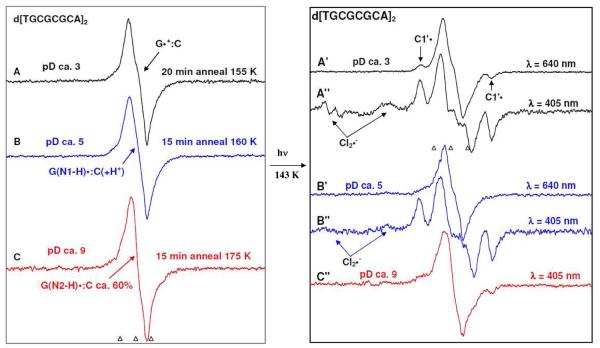
Figure 4.
Left panel: ESR spectra of one-electron oxidized d[TGCGCGCA]2 (3 mg/ml) formed via one-electron oxidation by Cl2•− via thermal annealing the sample at the temperature range 155 to 175 K, in the presence of electron scavenger K2S2O8 in 7.5 M LiCl/D2O. Spectrum (A, black) at pD ca. 3 is assigned to the cation radical state (G•+:C); spectrum (B, blue) at pD ca. 5 to the intra-base pair proton transferred state (G(N1-H)•:C(+H+)) and spectrum (C, red) at pD ca. 9 to the deprotonated state (G(N2-H)•:C (ca. 60%) and (G(N1-H)•:C (ca. 40%)) 9. Right panel: Spectra are obtained after exposure of duplicate samples at each pD to 640 nm for 1h (40 mW) (Spectrum A′, black, pD ca. 3 and Spectrum B′, blue, pD ca. 5) and to 405 nm (30 mW) for 30 min (Spectrum A″, black, pD ca. 3, Spectrum B″, blue, pD ca. 5, and spectrum C″, red, pD ca. 9) lasers at 143 K. Photoexcitation of one-electron oxidized Guanine in d[TGCGCGCA]2, at pDs ca. 3 and 5 using 405 nm laser led to loss of one-electron oxidized guanine (20% remaining) with the concomitant formation of sugar radicals having predominant C1′• and a small extent (ca. 5%) of C5′ •. Only in the case of 405 nm photoexcitation, formation of matrix radical (Cl2•−) is observed. No photo-conversion is found at pD ca. 9 as shown in spectrum C”. Spectra A′ (pD ca. 3) shows the small amount (ca. 15 %) of formation of C1•′ via 640 nm photoexcitation of the cation radical state (G•+:C) whereas spectrum B′ shows very little photoconversion at pD ca. 5.

