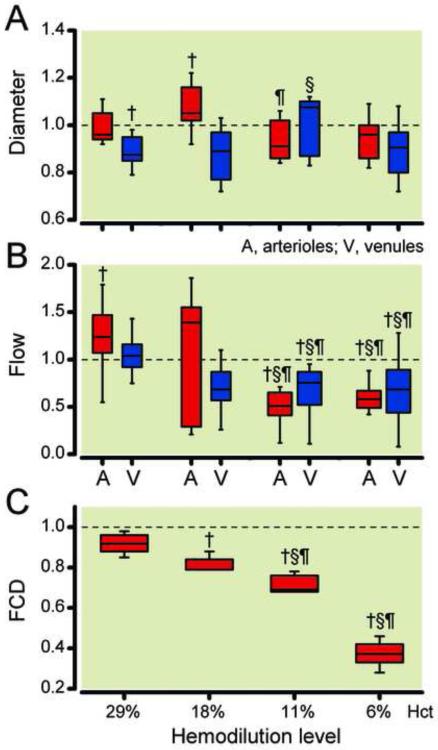
Figure 3.
Relative changes from baseline in arteriolar (A) and venular (V) diameter (Panel A), blood flow (Panel B) and functional capillary density (FCD, Panel C) at different degrees of hemodilution. Broken line represents baseline level. Diameters (μm, mean ± SD) were for baseline (arterioles: 65.1 ± 6.1, n = 104; venules: 67.9 ± 8.9, n = 112). n = number of vessels studied. Red blood cell velocities (mm/s, mean ± SD) were for baseline (arterioles: 4.3 ± 0.7, venules: 2.3 ± 0.5). Calculated flows (nl/s, mean ± SD) were for baseline (arterioles: 14.9 ± 3.1; venules: 7.7 ± 2.2). Functional capillary density (1/cm, mean ± SD) was for Baseline (114 ± 12). FiO2, fraction of inspired oxygen. †, P < 0.05 compared to baseline; §, P < 0.05 compared to 29% hematocrit; ¶, P < 0.05 compared to 18% hematocrit; ‡, P < 0.05 compared to 11% hematocrit.

