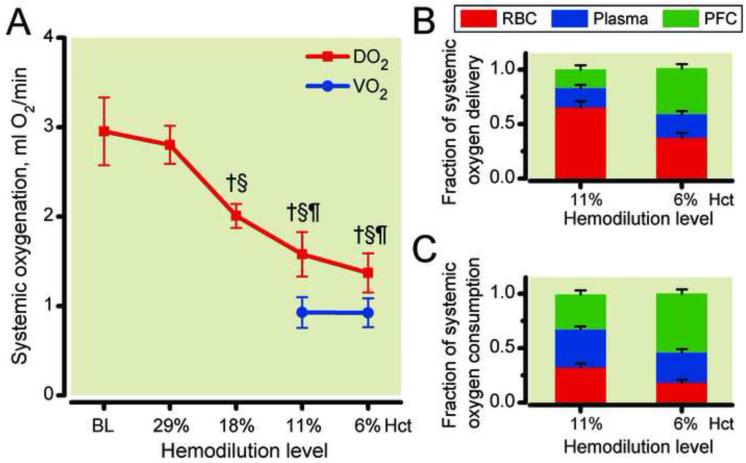
Figure 5.
Systemic oxygen delivery (DO2) and consumption (VO2) after hemodilution (Panel A) and fractional contribution of each phase to oxygen delivery (Panel B) and consumption (Panel C). †, P < 0.05 compared to baseline (BL). PFC, perfluorocarbon phase; RBC, red blood cells phase. §, P < 0.05 compared to 29% hematocrit; ¶, P < 0.05 compared to 18% hematocrit; ‡, P < 0.05 compared to 11% hematocrit. Calculations of oxygen transport were obtained using measured blood gas parameters and hemodynamics. The difference in DO2 between 11% hematocrit and 6% hematocrit is not statistically significant.

