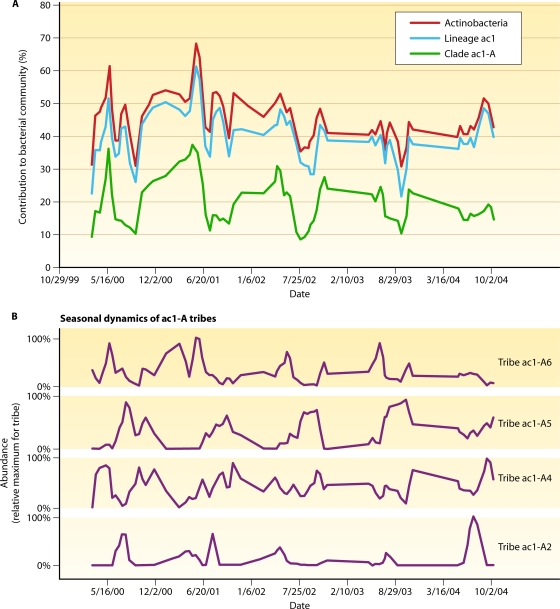
FIG. 12.
(A) Time course of the relative contributions by the acI lineage and acI-A clade (A) and the acI-A2, acI-A4, acI-A5, and acI-A6 tribes (B) of the phylum Actinobacteria to the bacterial community of Lake Mendota (by percentage of total fluorescence), inferred from automated ribosomal intergenic spacer analysis (ARISA) according to methods described previously (141). Sampling was conducted biweekly for 4 years during the ice-off period of the lake. The curves are constructed as a moving average (n = 2) of the relative contribution data. For comparison, the tribe plots are scaled to the maximum fluorescence observed for each tribe.

