
Figure 1.
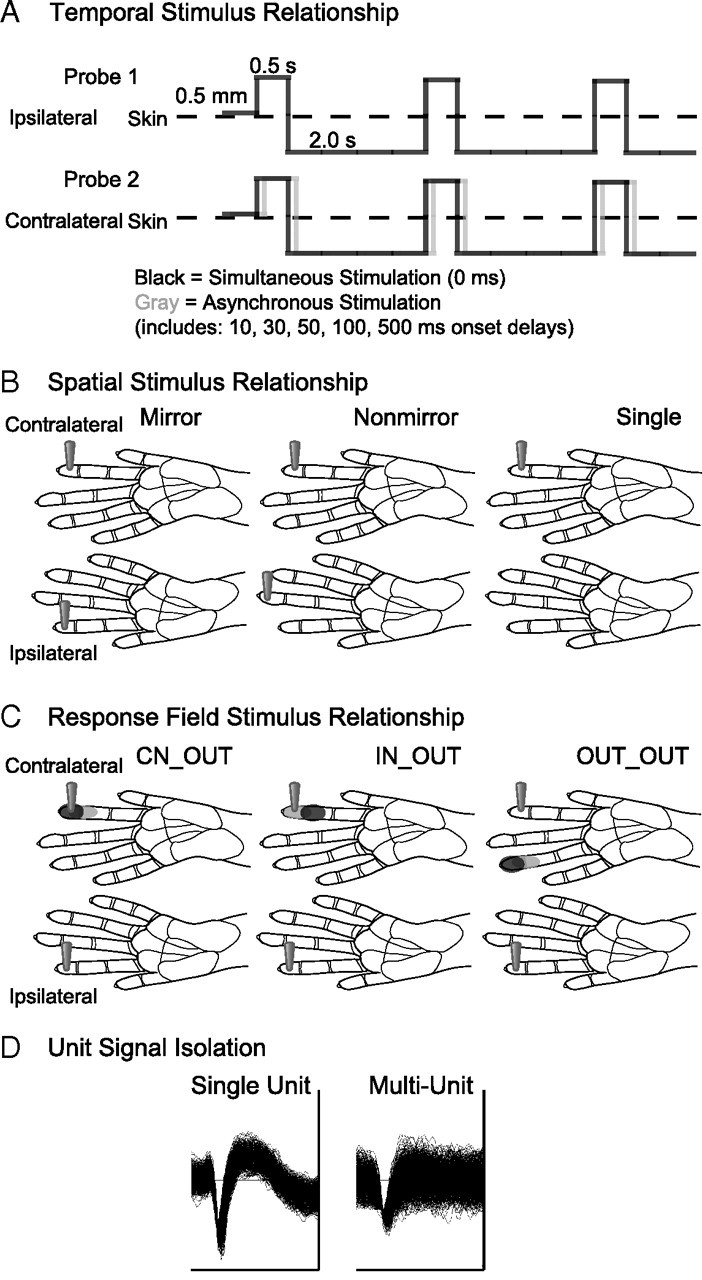
Schematic representations of data categories for analysis. A, The temporal pattern of stimulation is depicted by solid lines indicating the duration that the stimulus probe indents the skin (0.5 s), the depth of indentation (0.5 mm), and the duration the stimulus probe is off the skin per stimulus cycle (2.0 s). Paired stimulation, indicated by the schematics of Probe 1 and Probe 2, was simultaneous or asynchronous. To depict asynchronous stimulation generally, the gray solid line representing Probe 2 is shifted relative to the black solid line. The two probes are presented to different skin sites on the hand; however, the schematic depicts the overlap in contact time of the stimuli presented via Probe 1 and Probe 2. B, The spatial stimulus relationships were divided into three categories, illustrated by the locations of the stimulus probes on schematics of the owl monkey hands for dual probes on two hands (mirror and nonmirror locations) and a single probe on one hand as a control category. C, The response field category is determined by the response field of the unit relative to the stimulation location. Black shading on schematics of the owl monkey hand indicates the center of the response field for a hypothetical unit. Gray shading on the hand indicates locations inside the response field, but outside the center “hotspot” for the hypothetical reference unit. The locations of the two probes indicate the location of the stimulation relative to the response field for each response field category. D, Data were also classified by the quality of the signal isolation into single units or multiunits. Examples of each unit type are shown from monkey case B. The trace window for each unit shown span 128 μV and 1.6 ms.