
Figure 2.
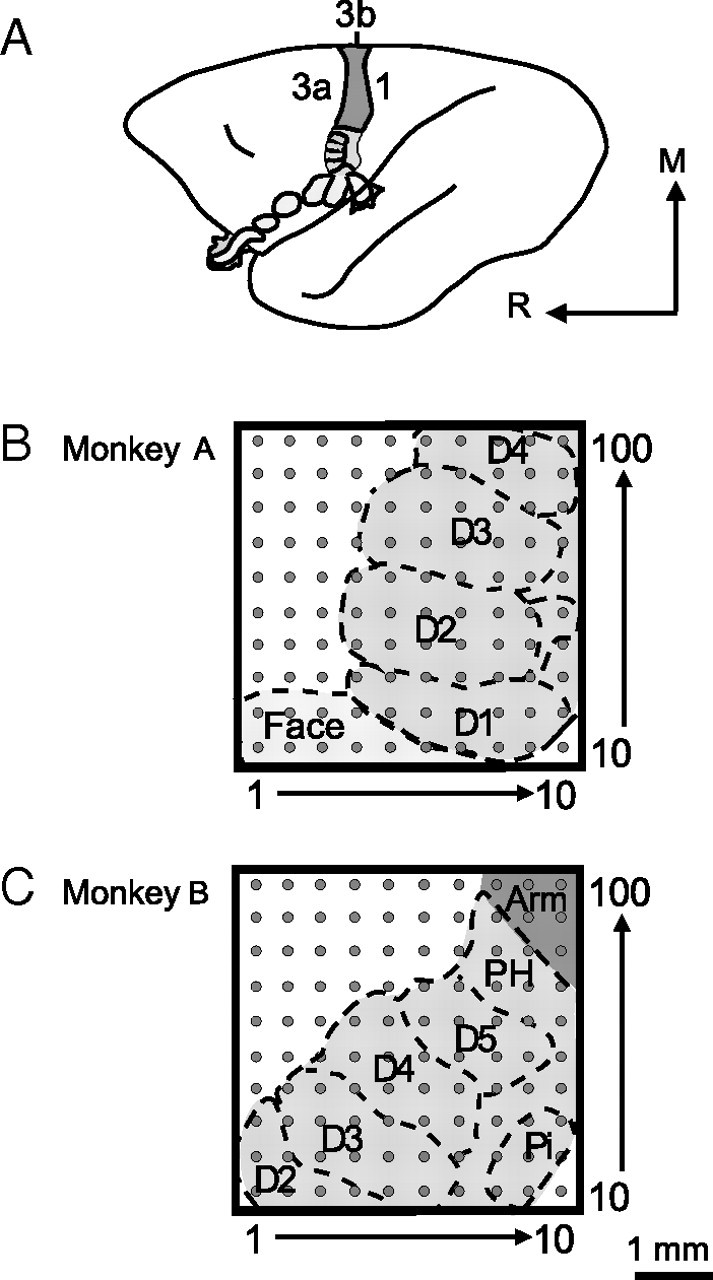
Schematic reconstructions show 100-electrode array placement in S1 of two owl monkey cases. A, A schematic of the owl monkey brain is shown with area 3b highlighted, as neurons in areas 3a and 1 tend not to respond well to light tactile stimulation under the anesthetic conditions of these experiments. The orientation of the brain is indicated by the arrows; R, rostral and M, medial. B–C, Electrode locations in each owl monkey case were approximated based on examination of myelin-stained sections of flattened cortex and the results of receptive field mapping during recording experiments to estimate the digit and palm pad representations. The placements of the 100-electrode array in each case tended to cover a large part of the area 3b hand representation. The 1 mm scale bar refers to the array size for both monkey cases. D, Digit; PH, hypothenar palm pad; Pi, insular palm pad.