
Figure 5.
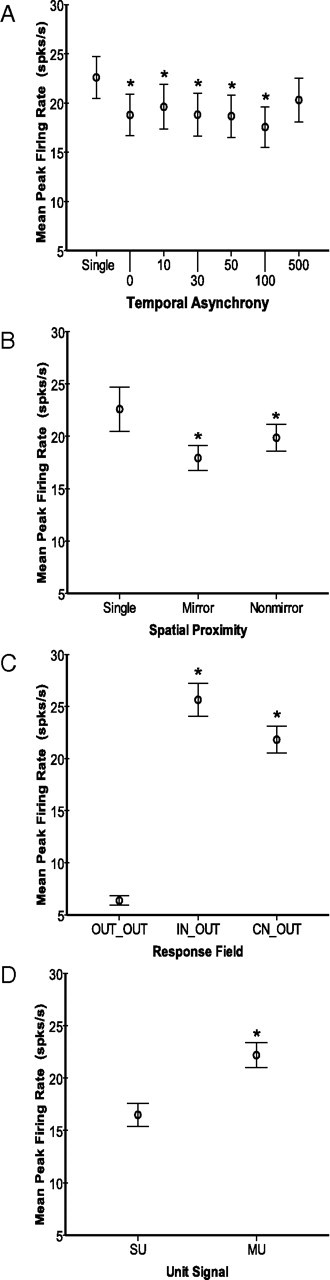
Average response magnitudes differ across spatial and temporal stimulus factors. Plots of group averages shown for spatiotemporal stimulus categories. Error bars represent 95% confidence intervals for all panels. Asterisks indicate significant differences relative to the first category in each panel. A, Means of peak firing rate values (spikes/s) are plotted for each temporal stimulation category. Control stimulation on the contralateral location resulted in significant differences from all of the other groups except for the 500 ms stimulus onset delay group. The 100 ms delay group was significantly different from all other groups. The 500 ms delay group was significantly different from all other groups except for 10 ms (and the contralateral control group). All other comparisons not noted were significantly different. B, Means of peak firing rate values are plotted for the two spatial proximity categories: Mirror and Nonmirror. These two groups were not significantly different. C, Means of peak firing rate values are plotted for each type of relationship of the response field to the stimulus locations. Peak firing rates were lower when the stimuli were outside of the response field (OUT_OUT) compared with when the contralateral stimulus was inside the RF (IN_OUT and CN_OUT), and the IN_OUT and CN_OUT groups were not significantly different from each other. D, Means of peak firing rate values are plotted for single units and multiunits, averaged across all stimulus conditions. MUs tended to have higher peak firing rates than SUs.