
Figure 6.
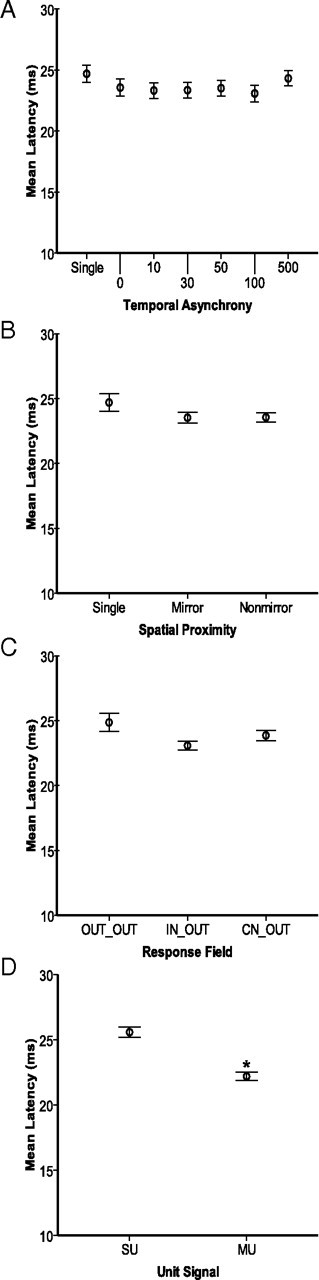
Average response latencies show few differences across spatial and temporal stimulus factors. Conventions follow Figure 5. Error bars represent 95% confidence intervals for all panels. Asterisks indicate significant differences relative to the first category in each panel. A, Mean response latencies (ms) are plotted for each temporal stimulation condition. The control refers to the contralateral stimulus, and numbers refer to the delay between the onset of the ipsilateral stimulus and the onset of the contralateral stimulus (second) from 0 to 500 ms. No pairwise comparisons were significantly different. B, Mean response latencies are plotted for conditions in which the stimulation locations on the two hands were in matched locations on mirror digits (Mirror) and when the stimulation sites were located on different digits of the two hands (Nonmirror). The mean latencies were not significantly different. C, Mean response latencies are plotted for the relationships of the response field of the neurons to the stimulus locations. Latencies were longer when both stimuli were presented outside of the neuron's response field (OUT_OUT) compared with when the contralateral stimulus was inside the response field (IN_OUT and CN_OUT). D, Mean response latencies are plotted for single units and multiunits, averaged across all stimulus conditions. MUs tended to have shorter latencies than SUs.