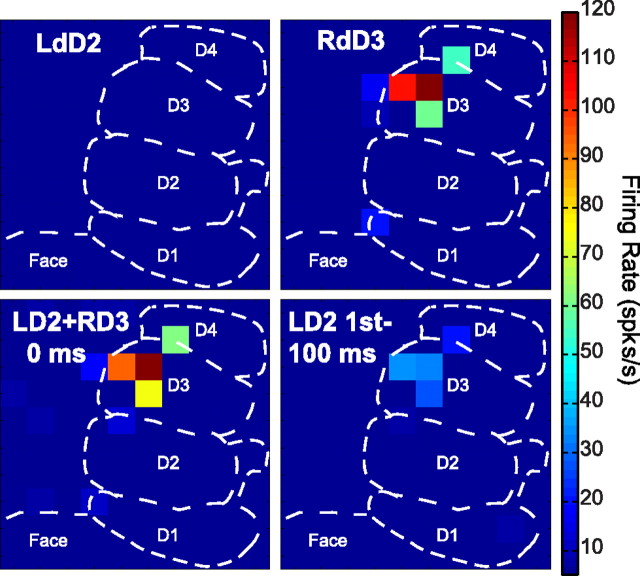
Figure 7.
Peak firing rates represented as color maps across the 100-electrode array during bimanual stimulation. Examples of the peak firing activity across the multielectrode array are shown under four experimental conditions in monkey A. Each square represents an electrode in the array and the peak firing rate value of the unit with the highest firing rate averaged over 100 trials during the 50 ms response window. The color scale ranges from 5 to 120 spikes/s, with hot colors representing higher peak firing rates. Electrodes from which no significant responses were obtained during the stimulation are indicated in dark blue (no squares). The dashed lines indicate approximate locations of the representations within area 3b. A, Peak firing rates in case A during a stimulation series on mirror locations on distal digit 2 (dD2) show that no driven activity (> 5 spikes/s) was found when a single site on the ipsilateral digit was stimulated (top left). As expected, activity was evoked when the contralateral distal digit 3 (dD3) was stimulated (top right). When the two nonmirror sites were stimulated simultaneously (lower left), peak firing rates decreased on average across the recording area; however, the effect was not uniform. When the ipsilateral digit was stimulated 100 ms before the onset of the contralateral stimulus, the firing rates were suppressed (lower right). This is one example of the response patterns that were summarized by quantifying the modulation of individual neurons across conditions.

