Figure 8.

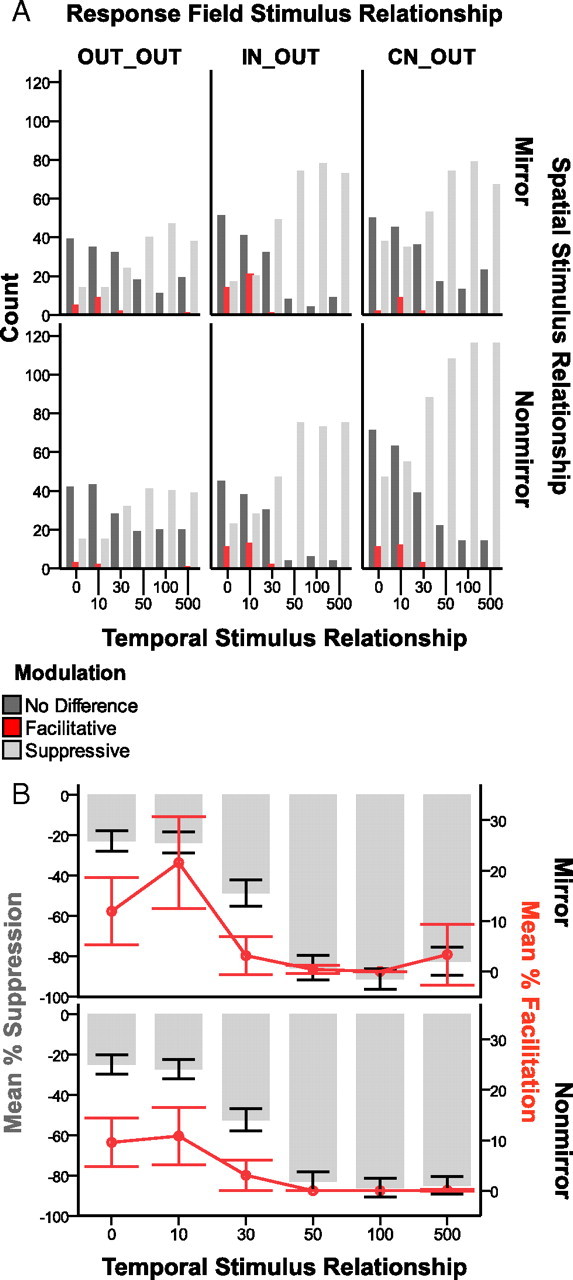
Suppression dominates firing rate modulation across spatiotemporal stimulus conditions. A, Comparing the expected sum of the responses to ipsilateral and contralateral stimulation to the actual responses resulted in modulation categories of: “No Difference” compared with the response to the contralateral stimulus alone, “Facilitative” compared with the summation of the responses of the controls, and “Suppressive” compared with the response to the contralateral control. Shaded bars represent the modulation categories. The types of paired stimulation conditions are grouped on the x-axis referring to the stimulus onset delays from 0 to 500 ms, in which the contralateral stimulus was always presented after the ipsilateral stimulus. The row panels show the total counts of these categories for the two spatial stimulus proximity categories, Mirror and Nonmirror. The column panels divide the data based on the response field category: OUT_OUT, IN_OUT, and CN_OUT. As expected, we collected fewer responses to stimulation when both stimulation sites were outside the response field of the neuron, and the counts reflect this, but the trends were the same across the categories. Suppression dominated the modulation types, particularly at longer stimulus onset delays (50–500 ms); whereas many responses were classified as no difference for short stimulus onset delays (0–30 ms). Facilitation occurred rarely, but was predominantly found when the stimulus onset delays were short (0–30 ms). B, The percentage of facilitation and suppression was quantified to provide an index for how much the peak firing rates during paired stimulation differed from expected across the temporal stimulation conditions (x-axis). The values are collapsed across the response field categories, but separate panels show the effects for stimulation on Mirror locations and Nonmirror locations. The plots have dual y-axes such that the mean percentage of suppression in each category is shown by the gray bars and the values follow the left axis. The mean percentage of facilitation is shown by the red line, and data markers and the values follow the right axis. Error bars are 95% confidence intervals. Using this index, when the response to paired stimulation does not differ from the contralateral response, the value is zero. The average percentages for suppression and facilitation include the zero values. The magnitude of facilitation dropped near zero when stimulus onsets were separated by 50–500 ms and hovered around a 10% difference when stimulus onsets were closer in time. The average magnitude of suppression was low when the stimulus onsets were close in time, and increased when the stimulus onsets were separated by longer delays. Responses were suppressed the most on average, by 92%, when mirror locations were stimulated with a 100 ms delay in stimulus onsets.
