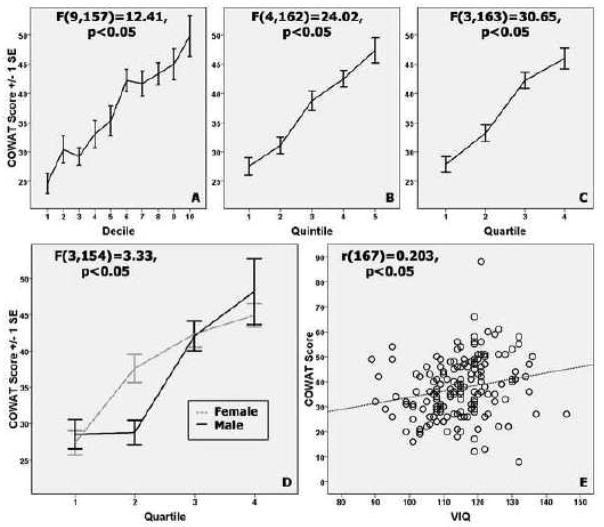
Figure 1. Age-related trajectories of COWAT performance improvements with varied age bins.
Top panels: Mean COWAT scores across (A) decile, (B) quintile, and (C) quartile age groupings. Statistical results of the age terms in the one-way ANOVAs (IV=age group, DV=COWAT total score) are inset for each plot. Panel D: Age-related trajectories for COWAT performance improvements, accounting for quartile age group and sex (dashed line=females, solid line=males). The difference between males (M(SD)=28.76(7.79)) and females (M(SD)=37.00(9.08)) is only statistically significant (t(41)=−3.184, p<0.05) within the 2nd quartile (ages 13.58–16.45). Panel E: Correlation between VIQ and COWAT score.

